Our first summer interns

Read these reflections from our first cohort of Perioperative Data Science summer interns.

Henry Spradlin:

The first thing I would like to do is thank Dr. Berkowitz for looking into the position, Dr. Melvin for offering me the position and helping me through my project, and Dr. Godwin for any other help I needed along the way. I quickly found one of the things I appreciated about this position was that everyone on the team is doing something that matters. During our daily check-in, Dr. Melvin and Dr. Godwin would mention the projects they were working on such as using AI with glucose monitoring or using image analysis on radiology images. When I initially met with Dr. Melvin, he asked me what I wanted to get out of this internship; I explained I wanted to improve my python skills. Machine learning is fascinating to me but as I am going into aerospace engineering, I figured a general knowledge of python would help me most in the future. Dr. Melvin started me right away with a project that improved my skills. The overarching goal of my project (in conjunction with Daniel Harrod) was to create a self-compiling database of past resident lectures for easy reference (nobody wants to watch 12 years of recordings for the two sentences of information they need). My part focused on taking a pre-transcribed lecture, summarizing that, and extracting the keywords. This fit my internship goal extremely well because it allowed me to practice writing a lot of more basic code engraining python syntax in my head as well as learning a few more advanced concepts. 

Andrew Glassford:

I spent my internship working on the Citation Count Prediction project, where the goal is to create an AI model that can read a scholarly paper’s title, abstract, and metadata, and then (accurately) predict how many future papers would cite this one. Dr. Godwin leads the CCP project, so I would technically be under his supervision, although Dr. Melvin was always ready to give advice when needed.

My first task was to recompile some of the test data that we were going to use. We wanted an extra datapoint, which meant altering and re-running the whole fetch-and-organize program. I was then tasked with finding a good model to read our data and make predictions. After experimenting with OpenAI’s GPT-3 and finding limited success, we opted for MATLAB’s text processing. After hybridizing NLP and MLP models built from scratch, we decided to replace the basic NLP with a pre-trained model called BERT. It produced the best results to date, with an overall accuracy of 65% and an AUC-ROC of 0.71. 

I learned a surprisingly broad array of skills, from using MATLAB to how to work on a research team. Apparently, there’s a difference between machine learning and deep learning, and just because it’s called “deep” doesn’t mean it’s actually better. I was exposed to a whole new world of business applications, like Azure DevOps and RocketChat. I even learned about and got certified to handle protected medical data! And, of course, no internship would be complete without some great mentors to patiently explain why exactly I was entirely wrong, several times over. My biggest takeaway from this internship probably sounds silly, but it’s true: just keep trying stuff. When an idea didn’t work, we didn’t try to brute force some haphazard nonsense; we backed up, analyzed our results, and moved on to the next option. Good work advice, and good relationship advice, too. Overall, an excellent enrichment experience.

Daniel Harrod:

Coming soon!

The State of Data Science

Our Department Chairman, Dr. Dan Berkowitz, recently gave a “State of the Department” address. We were honored and humbled by the number of mentions of the Data Science team. Here are the highlights of the Data Science activities reported on during the State of the Department address.

The Team

In October 2021, we co-recruited a data scientist with Radiology. Dr. Ryan C. Godwin joined us shortly before his daughter was born, meaning we had the pleasure of welcoming him to the department and his daughter to the world! We have also recruited three data science interns for summer 2022.

Accomplishments

Since January of 2021, our team has authored or co-authored seven published or accepted manuscripts.

  1. Zaky A, Younan DS, Meers B, Davies J, Pereira S, Melvin RL, Kidd B, Morgan C, Tolwani A, Pittet JF. End-of-procedure volume responsiveness defined by the passive leg raise test is not associated with acute kidney injury after cardiopulmonary bypass. Journal of Cardiothoracic and Vascular Anesthesia. 2021 May 1;35(5):1299-306.
  2. Mamidi TK, Tran-Nguyen TK, Melvin RL, Worthey EA. Development of An Individualized Risk Prediction Model for COVID-19 Using Electronic Health Record Data. Frontiers in big Data. 2021 Jun 4;4:36.
  3. Berenhaut KS, Moore KE, Melvin RL. A social perspective on perceived distances reveals deep community structure. Proceedings of the National Academy of Sciences. 2022 Jan 25;119(4).
  4. Treacher AH, Garg P, Davenport E, Godwin R, Proskovec A, Bezerra LG, Murugesan G, Wagner B, Whitlow CT, Stitzel JD, Maldjian JA. MEGnet: Automatic ICA-based artifact removal for MEG using spatiotemporal convolutional neural networks. NeuroImage. 2021 Nov 1;241:118402.
  5. Melvin RL, Abella JR, Patel R, Hagood JM, Berkowitz DE, Mladinov D. Intraoperative utilisation of high-resolution data for cerebral autoregulation: a feasibility study. British journal of anaesthesia. 2022 Mar 1;128(3):e217-9.
  6. Melvin RL, Broyles MG, Duggan EW, John S, Smith AD, Berkowitz DE. Artificial Intelligence in Perioperative Medicine: A Proposed Common Language with Applications to FDA-Approved Devices. Frontiers in Digital Health.:64.
  7. Melvin RL, Barker SJ, Kiani J, Berkowitz E. Pro-Con Debate: Should Code Sharing Be Mandatory for Publication? Anesthesia and Analgesia. In press.

We have 7 more manuscripts in active preparation! Additionally, we submitted 6 external funding applications and are preparing 2 more. Our work has been the focus of 6 conference presentations, 2 webinars, and an Intel Spotlight video. We’ve also spent this year teaching via 5 grand rounds, invited lectures and colloquia and taught 1 class with a fully new curriculum designed by us!

Vision, values and goals

Reflecting on this last year, we took a moment to recenter on our vision, values and goals. Reflecting on these, we’ve set 3 goals for the coming years.

  1. Integrate Data Science into all areas of the department, adding at least 1 operations and 1 education project.
  2. Integrate into at least 1 hospital-wide initiative.
  3. Publish at least 1 “precision” and 1 “prediction” paper per year.

Notable publications to ring in the new year

Two publications from our data science faculty have recently been published in high-profile journals.

First, a feasibility study to determine the optimum blood pressure of cardiac patients during surgery appeared in British Journal of Anesthesia (BJA: impact factor 9.1, ranking it 2 out of 33 in Anesthesiology at the time of this writing) in December. An earlier blog post described the preliminary work for this article. Shortly after appearing on the BJA website, this work was the topic of an editorial discussing its importance — introducing a bulk, automated process for what was preciously a laborious clinical study procedure that had to be conducted one patient at a time. As described by its senior author, Dr. Domagoj Mladinov, “[this] study demonstrates feasibility of automatically calculating optimal arterial blood pressure based on cerebral autoregulation limits derived from cerebral oximetry during cardiac surgery.” The novelty of this methodology is echoed in the editorial by Hogue and colleagues, “What this report demonstrates is the feasibility of an operator-independent method for monitoring CBF [cerebral blood flow] autoregulation.” Additionally, this work from UAB Anesthesiology and Perioperative Medicine Faculty suggest a methodology for moving autoregulation out of the realm of retrospective studies and toward clinical interventions via a real-time, streaming data analysis platform being actively developed in our department in collaboration with Medical Informatics Corp (MIC, Houston, Texas).

Second, a novel algorithm for for extracting information on community structure from graphs (networks) is in press with Proceedings of the National Academy of Science (PNAS: impact factor 11.2), currently available online. This work — by our Principal Data Scientist in collaboration with his former M.A. thesis advisor at Wake Forest University — suggests a social framework for discussing and calculating the centrality of nodes (participants) in a network. This novel algorithm was cited (page 5) prior to publication by researchers seeking to use the algorithm efficiently on very large networks. As described by the authors, this work demonstrates “how meaningful community structure can be identified without additional inputs (e.g., number of clusters or neighborhood size), optimization criteria, iterative procedures, nor distributional assumptions.” That is, aside from the network itself, an investigator needs no further a priori information to extract the underlying community structure and detect highly central — or important — nodes.

Spring 2022: Teaching and Learning

In the spring semester of 2022, our Principal Data Scientist, Dr. Ryan L. Melvin (me), will be teaching INFO-403 Bioinformatics-II (Algorithms) here at UAB. The course serves as an introduction to several computational techniques and forms of algorithmic thinking. Computational topics include dynamic programming, optimization, hidden Markov models, graph algorithms, and unsupervised machine learning.

Bioinformatics Algorithms print edition (online is used for this course). Image courtesy of the authors.

The course structure is modeled after one taught at Carnegie Mellon by one of the textbook’s authors, Phillip Compeau. An UAB-specific special edition of the online, interactive textbook will be the primary resource for content and assignments for those taking the course. Each chapter involves several assigned software/coding challenges that coach students through building famous bioinformatics algorithms from scratch. These assignments are programming-language-agnostic, so students can use whatever scripting or programming language is most comfortable for them. Though, all demos and instructor solutions will be presented in Python, since that is the language the instructor is most comfortable with. 🙂

In terms of in-class meetings, the course has a flipped structure. Each week, the course will meet for one 2.5-hour session. The session will be broken up into roughly five 30-minute segments with a break after the first two. The segments will be questions and troubleshooting/hints from the week’s assigned reading and software challenges, a hands-on activity that connects to a primary biology or algorithm concept from the week, and 3 rounds of discussion questions and graded student presentations.

The hands-on activities are pretty off-beat and will hopefully provide students with a fun, unique experience. For example, one week student groups will play a few rounds of the board game Pandemic. The next week, different groups will conduct a forensic investigation of the game and try to reconstruct the original board state (connecting to the biological concept of disease spread and the algorithmic concept of tree-based methods).

The primary content delivery method is an online, interactive textbook. For the outliers who successfully learn from lectures, recorded lectures are also available. Additionally, the vast majority of students’ final course grades come from interactions with the online textbook. The remaining portion comes from class participation.

For students at UAB taking this course, the online, interactive textbook must be purchased using a link to the UAB-specific special edition. The link is provided in the online syllabus in the course’s Canvas page.

September: A busy month for Perioperative Data Science

It’s been a busy time in Perioperative Data Science.

Research and Publications

In just the last month, we received reviews on three papers and have already resubmitted two of those. Both have been accepted pending a minor revision — one in Anesthesia and Analgesia (A&A) and one in British Journal of Anesthesia (BJA). The A&A paper is an “Open Mind” article debating the pros and cons of having journal-level requirements for sharing code used in research. The BJA article discusses a retrospective study we performed to calculate personalized intraoperative blood pressure recommendations for patients using the Sickbay platform. Our third paper we received feedback on in the last month is also aimed at A&A and proposes a clinician-friendly taxonomy for classifying and understanding the utility of Machine Learning (ML) and Artificial Intelligence (AI) algorithms.

Also in the last month, we wrapped up two projects — one on predictors of renal failure and another on cost savings of a specialized perioperative service — and are currently writing manuscripts for them. Along with those, we also submitted an article to Journal of Clinical Anesthesia on predicting blood transfusion need.

Quality Improvement

Perioperative Data Science was asked to help out with a high-profile, institution-wide project to understand the impact of an Opioid Stewardship Program implemented a few years ago. Those results will be presented to hospital leadership soon and may inform decisions on next steps for the institutions Opioid Stewardship Program.

Additionally, Perioperative Data Science led a recent discussion on the next steps for a departmental hypotension prevention initiative. In this instance, we are predicting adverse patient outcomes related to hypotension, planning to convey those to providers so that they can be fully equipped with an understanding of the impact of blood pressure management on the patients under their care.

Operations

In this same time frame, Administrative team asked IT and Perioperative Data Science for assistance understanding the impacts of longer working days on department resources. I think it comes as no surprise that the continued pandemic has greatly impact every aspect of our work in the Department of Anesthesiology. And now we are attempting to quantify just how much the pandemic has stretched our resources. The results of this project are scheduled to be presented to Department leadership soon.

Education

We took on two projects with medical students over the last month. One of those is a SWOT (Strengths, Weaknesses, Opportunities, and Threats) analysis of AI/ML in Perioperative Medicine. The other is a document-processing project to automatically process reports from echocardiograms into a structured, tabular format that can be used in AI/ML algorithms. This project will also make this data more accessible to researchers, QI practitioners, and educators.

Recruiting

This last month we finalized the joint recruitment of a data scientist shared with Radiology. We’ll be announcing the details on this new hire’s start date. Stay tuned!

AI Against Cancer 2021 Hackathon

On August 9 and 10, I participated in the UAB AI Against Cancer Data Science Hackathon. My teammates and I applied recent advances in Computer Vision Artificial Intelligence applied to pathology slides (such as tissue samples of brain cancer). We were one of the three teams receiving the “main awards” of the hackathon. The three winning teams were selected on criteria similar to that of NIH grant-proposal review (see details at Hackathon 2021 – Cancer Bioinformatics and Data Science (C-BIDS) (ubrite.org)). You can view our showcase presentation of our work here on YouTube.

My teammates were Thi K. Tran-Nguyen and Tarun Karthik Kumar Mamidi, along with Liz Worthey and Rati Chkheidze (these two proposed the project focus). Together, our skills covered the gamut of data wrangling, model development, and medical relevance. As a result, we developed a proof of concept system for combining pathology slides and omics data in order to select cellular pathways based on omics data and have the AI highlight the participating cells on the slide (Figure below).

Conceptual example of our method connecting phenotype (cell clusters on slides) with genotype (clusters from omics data representing pathways).

We set a particularly difficult challenge for ourselves, as we wanted to develop an unsupervised methodology. That is, we wanted an AI to accomplish this task without expert input or intervention. We did not provide examples of “right” answers for the computer to learn from! Overall, our short time in the hackathon proved feasibility for a method for connecting genotype (from omics data)

Practical Applications of Data Science

A summary of Anesthesiology Grand Rounds from 2 August 2021

On August 2, 2021, I presented at Grand Rounds for our department (Anesthesiology and Perioperative Medicine). For those who missed it (and those outside the department), I’ve prepared a text summary of the presentation.

The first quarter of the presentation focused on the distinction between work that is purely in the realm of statistics compared to projects that require a data science approach. Statistics work is typically focused on detecting relationships in data and quantifying the significance of those relationships. In purely statistical work, hypotheses typically come first. In data science projects, often the reverse is true. Hypotheses are often the outcome of these projects. Data Science projects are often focused on making a prediction. After a model is developeds, hypotheses about why the model is good at making predictions (if it is) are formed and can spur future research. Data science tends to be hypothesis-generating rather than hypothesis-testing. For an expand discussion see my previous post on the topic of statistics vs machine learning specifically.

As an example of a Data Science project, I repeated a 5-minute presentation I gave at SOCCA’s (Society of Critical Care Anesthesiologists) annual meeting in May of this year. The talk itself is available on demand for those who attended SOCCA’s annual meeting in 2021. In this project, we explored whether machine learning techniques can predict incidence of allogenic blood transfusion products and identify important risk factors. This was a data science project because it started with a question (as opposed to a hypothesis), addressed a extant data set that might contain the answer, and assessed connections between patient outcomes and features after models making predictions were trained.

I summed up this section of the talk a rule of thumb: “Statistics is a hypothesis in search of data; whereas, data science is data or predictions in search of a hypothesis.”

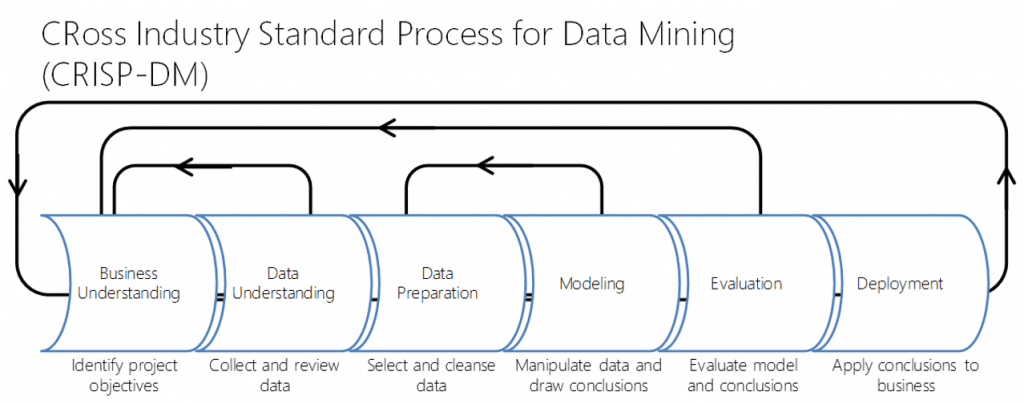
The next section focused on business understanding as the key ingredient in data science projects. Knowing the question we’re trying to answer and the business purpose or significance of it is the primary focus of data science projects. Building models (be they statistical or machine learning) is one small part of data science work. This is best visualized using the CRoss Industry Standard Process for Data Mining (CRISP-DM) project cycle (below).

Image from towardsdatascience.com

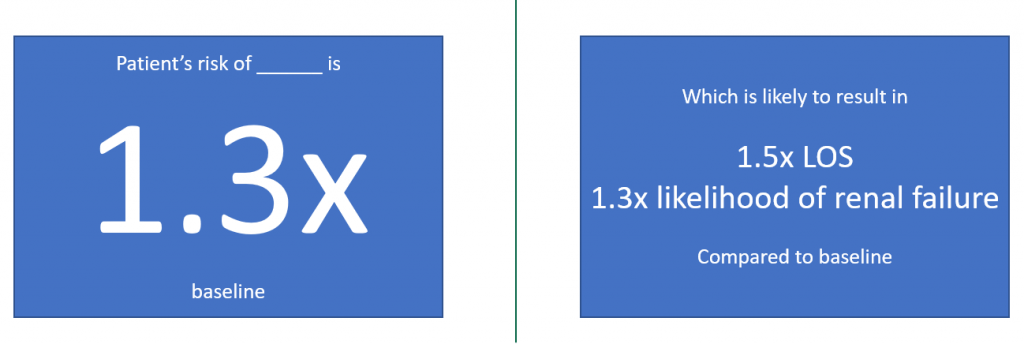
I then gave some concrete examples of outcomes of data science projects. For example, a project might result in a preoperative warning and risk assessment system (example below).

A made up illustrative example. No actual data was used, and no recommendations are being presented. This example should not be used by anyone for anything.

Next, I discussed our high-resolution, real-time data capture and analysis platform Sickbay, which I’ve posted about before. We recently submitted our first manuscript with data and analysis from the Sickbay system.

I reviewed the collaborations Data Science has brought to the department over the last year and closed the presentation with guidance on getting connected (slide below).

How to get connected to UAB Anesthesiology and Perioperative Medicine Data Science

Sample Size in Machine Learning and Artificial Intelligence

The lack of sample size determination in reports of machine learning models is a sad state of affairs. However, it also presents an opportunity. By including at least post hoc sample-size calculations in articles we submit, our Department can lead the charge for more rigorous machine learning and artificial intelligence methodologies.

If you’ve talked with me about starting a machine learning project, you’ve probably heard me quote the rule of thumb that we need at least 1,000 samples per class. I recently found out many data scientists only quote this rule when repeatedly pushed for a sample size estimate (see How Much Training Data is Required for Machine Learning? (machinelearningmastery.com)). As a result, I decided to do a literature search to see what better or newer answers to the question of sample sizes for machine learning might look like.

The problem is even bigger than I suspected! A recent review article [1] searched 167 articles related to machine learning and found only 4 attempt any kind of pre hoc sample size determination. The review also found 18 articles that attempted some kind of post hoc sample size determination.

Annoyingly, many of the pre hoc methods referenced work only for neural networks (only one of many kinds of machine learning). For example, a group from MIT determined a worst-case calculation method that ensures at least a specified fraction of images are correctly classified given a sample size N [2]. This calculation is helpful for deep learning, but it yields a prohibitively large number of samples needed for even a simple neural network (around 4,000 per class in a simple example calculation for a relatively simple network structure). Other methods borrow from statistics and essentially assume Cohen’s calculation for effect size generalizes to machine learning. For example, see this online article from Boston University School of Public Health (Power and Sample Size Determination (bu.edu)). However, this calculation neglects information about model type. Would we really expect all machine learning model types to have the exact same sample size needs? That seems unlikely.

One researcher has rigorously proved a method for calculating the probability that a model’s error rate is less than some percentage given a sample size and a theoretical property of a model called its “Vapnik–Chervonenkis dimension” [3] (also see Vapnik–Chervonenkis dimension – Wikipedia). However, this quantity is indeed theoretical and can only be bounded (setting an upper limit) for some model types. There’s no formulaic method for determining the exact quantity for a given model (at least not yet).

From the review article [1], it seems the most popular systematic approach for sample size determination is the post hoc method of fitting a learning curve. Essentially, you take increasingly large subsets of your data and calculate the error. For example, if I use 10% of my data, the error is y1. If I use 20%, the error is y2. Then you plot {y} as a function of number of observations in the subsample and fit a power law curve [1,4-5]. The resulting curve allows for inference of the needed sample size for a desired error rate.

The lack of sample size determination in reports of machine learning models is a sad state of affairs. However, it also presents an opportunity. By including at least post hoc sample-size calculations in articles, we can be leaders in the charge for more rigorous machine learning and artificial intelligence methodologies.

References

[1] Balki, I., Amirabadi, A., Levman, J., Martel, A. L., Emersic, Z., Meden, B., … & Tyrrell, P. N. (2019). Sample-size determination methodologies for machine learning in medical imaging research: a systematic review. Canadian Association of Radiologists Journal70(4), 344-353.

[2] Baum, E. B., & Haussler, D. (1989). What size net gives valid generalization?. Neural computation1(1), 151-160.

[3] Vapnik, V. (2000). The nature of statistical learning theory. Springer.

[4] Rokem, A., Wu, Y., & Lee, A. (2017). Assessment of the need for separate test set and number of medical images necessary for deep learning: a sub-sampling study. BioRxiv, 196659.

[5] Cho, J., Lee, K., Shin, E., Choy, G., & Do, S. (2015). How much data is needed to train a medical image deep learning system to achieve necessary high accuracy?. arXiv preprint arXiv:1511.06348.

A year of forming collaborations

June 1, 2021, marks my 1-year anniversary with the UAB Department of Anesthesiology and Perioperative Medicine. This last year has been one filled with new partnerships and exciting data science projects. Working here, I have formed connections across the department, hospital, campus, and other institutions (visualized in the figure below).

Network visualization of collaborations within the department (light blue), hospital and campus (green), and other institutions (gray).

Within the department, my research collaborations have focused on the development of artificial intelligence (AI) systems to reduce the cognitive load on clinicians. The bulk of these projects have been through joining research projects initiated by clinical faculty members. In these projects, Perioperative Data Science has developed AI methods that address non-hypothesis-driven questions. Some examples are

  • Predicting acute and delay kidney injuries from perioperative factors, past medical history, and biomarkers, [1]
  • Predicting blood transfusion product needs in high-risk cardiac surgery, [2-4]
  • Determining patient-specific blood pressure requirements during cardiac surgery,
  • Predicting post-PACU (post-anesthesia care unit) escalations of care,
  • Predicting outcomes of low intraoperative mean arterial pressure, and
  • Predicting bleeding risk for patients receiving heparin.

Across, UAB, I have collaborated with bioinformatics faculty, post-docs, and graduate students to develop a COVID-19 risk scorecard [5] and submit an application for an NIH grant to support building an AI to support patient nutrition initiatives. Collaborators from the UAB Department of Radiology and I recently submitted two abstracts and wrapped up a manuscript on materials for training clinicians in the appropriate use of AI tools [6-7].

With collaborators at UAB and Wake Forest, I am working on stratifying patients by risk for opioid-induced respiratory depression for enhanced monitoring. I have also initiated a multi-institution project to develop a zero-code machine learning software package that will both speed AI projects to machine learning experts and enable machine learning research for non-experts. I have also worked closely with the Sickbay(TM) from Medical Informatics Corp. development team to make sure our researchers’ needs are met by the tools Sickbay provides and assist in creating new tools when they are not. Additionally, I have initiated discussions with industry partners for sponsored research related to our clinical faculty’s work.

It has been an invigorating year of forming many connections. I look forward to even more in year 2!

[1] A. Zaky et al. (2021), “End-of-Procedure Volume Responsiveness Defined by the Passive Leg Raise Test Is Not Associated With Acute Kidney Injury After Cardiopulmonary Bypass,” J. Cardiothorac. Vasc. Anesth., vol. 35, no. 5, pp. 1299–1306, 2021, doi: 10.1053/j.jvca.2020.11.022.

[2] R.L. Melvin (presenter), D. Mladinov, L. Padilla, D.E. Berkowitz “Comparison of Supervised Machine Learning Techniques for Prediction of Blood Products Transfusion after High-Risk Cardiac Surgery,” at Society of Critical Care Anesthesiologists 2021 Annual Meeting, Virtual.

[3] R.L. Melvin (presenter), D. Mladinov, L. Padilla, D.E. Berkowitz “Comparison of Supervised Machine Learning Techniques for Prediction of Blood Products Transfusion after High-Risk Cardiac Surgery,” at International Anesthesia Research Society 2021 Annual Meeting. Virtual.

[4] R.L. Melvin (presenter), D. Mladinov, L. Padilla, D.E. Berkowitz “Comparison of Supervised Machine Learning Techniques for Prediction of Blood Products Transfusion after High-Risk Cardiac Surgery,” at Association of University Anesthesiologists 2021 Annual Meeting. Virtual.

[5] T.K. Kumar Mamidi, T.K. Tran-Nguyen, R.L. Melvin, E.A. Worthey (2021) “Development of An Individualized Risk Prediction Model for COVID-19 Using Electronic Health Record Data.” Front. Big Data 4:675882. doi: 10.3389/fdata.2021.675882

[6] A.M.A. Elkassem, A.M.A. (presenter), D. Nachand, J.D. Perchik, R. Mresh, M. Anderson, R.L. Melvin, A.D., Smith (2021) “Strengths, Weaknesses, Opportunities, and Threats (SWOT) Analysis of AI Algorithms in Abdominal Radiology,” submitted to SABI 2021. Washington, D.C.

[7] A.M.A. Elkassem, A.M.A. (presenter), D. Nachand, J.D. Perchik, R. Mresh, M. Anderson, R.L. Melvin, A.D., Smith (2021) “Strengths, Weaknesses, Opportunities, and Threats (SWOT) Analysis of AI Algorithms in Abdominal Radiology,” submitted to RSNA 2021. Chicago, IL.

Sickbay: A Brief Introduction

If you’re in the Department of Anesthesiology and Perioperative Medicine at UAB, you’ve probably heard about the high-resolution device integration, data-capture, and analysis platform called, “Sickbay.” Indeed, it is unique in its ability to chart and record, in a time synchronized fashion,  any and all  physiologic variables from our OR and critical care monitors and machines (ventilators etc.) at high frequency.  But what can you do with it?

Currently, our usage is exclusive to the Cardiovascular Operating Room (CVOR) and Neuro ICU (NICU). In the CVOR Sickbay can be used for research purposes. In the NICU, it can be used for research and remote monitoring.

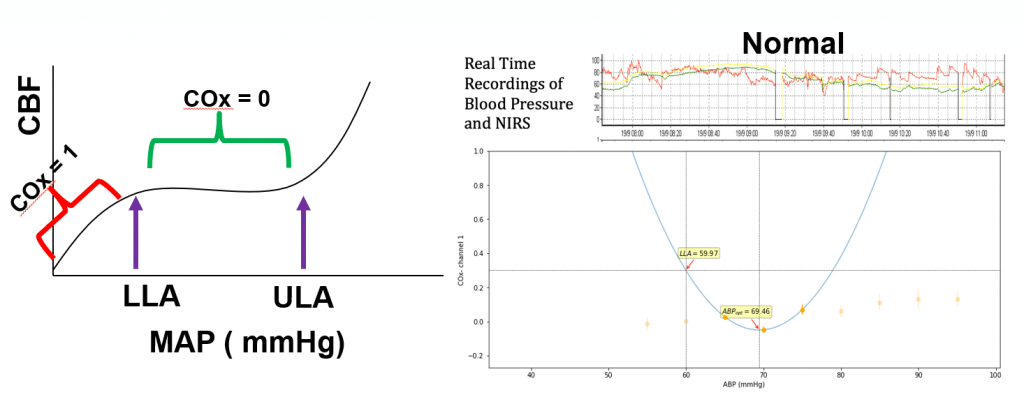
As one example of research  — championed by Domagoj Mladinov and Dan Berkowitz — in the CVOR we’re currently using the platform to analyze high-resolution Near Infrared Spectroscopy (NIRS) and Arterial Blood Pressure (ABP) (at 120Hz) signals to estimate patients’ lower limits of cerebral autoregulation. That is, we want to identify the optimal blood pressure for each individual patient (precision medicine and goal-directed therapy) rather than targeting blood pressure based on commonly accepted population-based standards. Similarly, for NICU patients with Intracranial Pressure Monitoring (ICP), we can calculate optimal blood pressure from a combination of ABP and ICP signals. Both interventions would have a goal of improving brain perfusion by individualizing blood pressure (and other) therapies.

Relationship between CPP and autoregulation index PRx. When in an impaired state, there is a positive relationship between changes in Cerebral Blood Flow (CBF) and mean arterial pressure (MAP). Curves use simulated data. LLA and ULA indicate the lower and upper limits of autoregulation respectively.

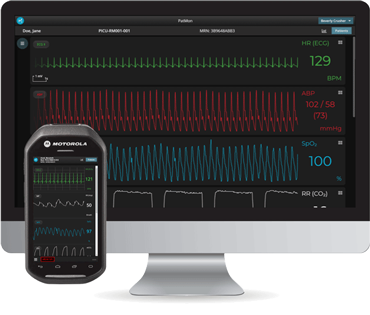
In the NICU, the platform is available for remote monitoring such as Gas Monitoring (e.g., respiratory rate), ECG Signals, Hemodynamics (e.g., arterial blood pressure), Temperature, CNS Monitoring (e.g., EEG). It can also provide continuous up-to-the-minute information trends from a patient’s entire (monitored) stay.

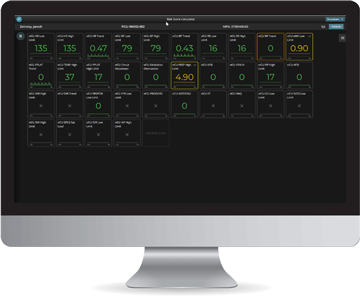
Sickbay also has the capability to use retrospective data to create risk-calculators that can be viewed from anywhere you can access the internet.

Finally, Sickbay has a built-in process for tracking and reporting all signals for patients enrolled in a study. All you need is a list of enrolled MRNs for your IRB-approved study that can be easily imported.

If you’re a faculty member in the department and are interested in applying this technology to your clinical practice or research project, feel free to reach out to Ryan Melvin (Principal Data Scientist), to learn more about Sickbay. Additionally, if you’re a faculty member from another UAB department and want to know more about potential collaborations involving Sickbay, reach out as well.

Example of remote patient monitoring with Sickbay (TM), curtesy of Medical Informatics Corp. No actual patient data is displayed.
Example of risk calculators in Sickbay (TM), curtesy of Medical Informatics Corp. No actual patient data is displayed.