For n = 3, a special case of the Wilconxon-ranksum test (https://projecteuclid.org/journals/annals-of-mathematical-statistics/volume-18/issue-1/On-a-Test-of-Whether-one-of-Two-Random-Variables/10.1214/aoms/1177730491.full) was derived as followed. The test is applied in https://www.frontiersin.org/articles/10.3389/fphar.2021.673621/full.
Given two sets of real values A and B, the probability p(xA = xB) when randomly select any pairs xA Î A, xB Î B. Thus, we have the null hypothesis p(xA > xB) = p(xA < xB) = 0.5, if A and B follows the same distribution. Then, when pairwise comparing A and B, each comparison can be considered a Bernoulli trial with probability of success p = 0.5, and the expected number of xA > xB, which is the statistical metric, is n(xA > xB) = |A|×|B| / 2.
In testing the sample, we count the real number n(xA > xB), denotes as N, over the |A|×|B| pairwise comparisons . The probability of getting at least N comparisons n(xA > xB) and more extreme result, which is the p-value, is

Where CN|A|×|B| is the number of combinations in picking N (success) over |A|×|B| trials. If A and B have 3 samples in each set, and xA > xB for all 9 pairwise comparisons, then p-value is 0.59 × C99 = 0.002. If xA > xB for 8 pairwise comparisons, then p-value is 0.59 × C89 + 0.59 × C99 = 0.0352.
Simulation 1. Here, in each experiment, both A and B has three random real numbers, that are drawn from the uniform distribution between 0 and 1. In the experiment, we count the number of comparisons such that xA > xB. We repeat the same experiment for 10000 times. The histogram of n(xA > xB) illustrates the ‘extreme’ portion (p-value) when N = n(xA > xB) ≥ 8. The Matlab code for the experiment is as follow.
numExperiment = 10000;
numAMore = zeros(numExperiment, 1); % n(A > B) in all experiments
for i = 1 : length(numAMore)
     A = rand(3, 1); % 3 uniform random number between 0 and 1
     B = rand(3, 1);
     for j = 1 : length(A)
          numAMore(i) = numAMore(i) + length(find(B < A(j)));
     end
end
hist(numAMore)
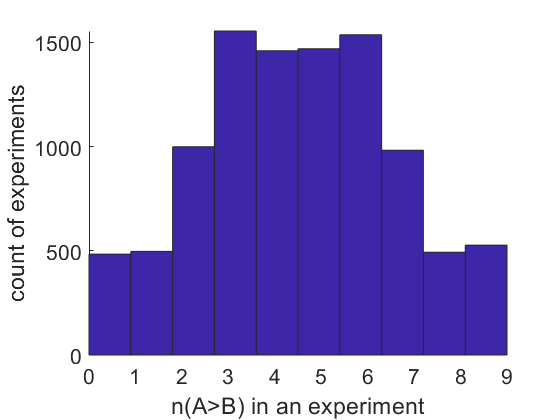
Figure 1 Distribution of n(xA > xB) when A and B in simulation 1.
Figure 1 shows that the proportion of n(xA > xB) ≥ 9 only takes a small proportion of the n(xA > xB) distribution. This reflects why we compute p-value = 0.002 if observing xA > xB for all 9 pairwise comparisons
Simulation 2. Similar to simulation 1, but A has 6 random numbers following the standard normal distribution, and B has 6 random numbers following the normal distribution with mean, which is also the median, of 0 and standard deviation of 2. Here, A and B has the same median
numExperiment = 10000;
numAMore = zeros(numExperiment, 1); % n(A > B) in all experiments
for i = 1 : length(numAMore)
     A = normrnd(0, 1, 6, 1); % 4 standard normal random numbers
     B = normrnd(0, 2, 6, 1); % 4 normal random numbers, mean = 0, std = 2
     for j = 1 : length(A)
          numAMore(i) = numAMore(i) + length(find(B < A(j)));
     end
end
hist(numAMore)

Figure 2. Distribution of n(xA > xB) in simulation 2.
Figure 2 reflects the small p-value (1.45×10⁻¹¹) when observing all 36 xA > xB pairwise comparisons. According to formula (1), the p-value is

The standard Wilcoxon-ranksum test result in very-small sample size cases
We also examine the standard Matlab implementation of the Wilcoxon-ranksum test (https://www.mathworks.com/help/stats/ranksum.html)
When n = 3 and n(xA > xB) = 9, for example, A = {3.1, 3.2, 3.3} and B = {2.1, 2.2, 2.3}, we observe
ranksum([3.1,3.2,3.3], [2.1,2.2,2.3])
yields p-value = 0.1.
When n = 6, for example A = {3.1, 3.2, 3.3, 3.4, 3.5, 3.6} and B = {2.1, 2.2, 2.3, 2.4, 2.5, 2.6}, we observe
ranksum([3.1,3.2,3.3, 3.4, 3.5, 3.6], [2.1,2.2,2.3, 2.4, 2.5, 2.6])
yields p-value = 0.0022
Further reading
Bian W, Chen W, Nguyen T, Zhou Y, Zhang J. miR-199a Overexpression Enhances the Potency of Human Induced-Pluripotent Stem-Cell–Derived Cardiomyocytes for Myocardial Repair. Frontiers in pharmacology. 2021 Jun 3;12:673621.
