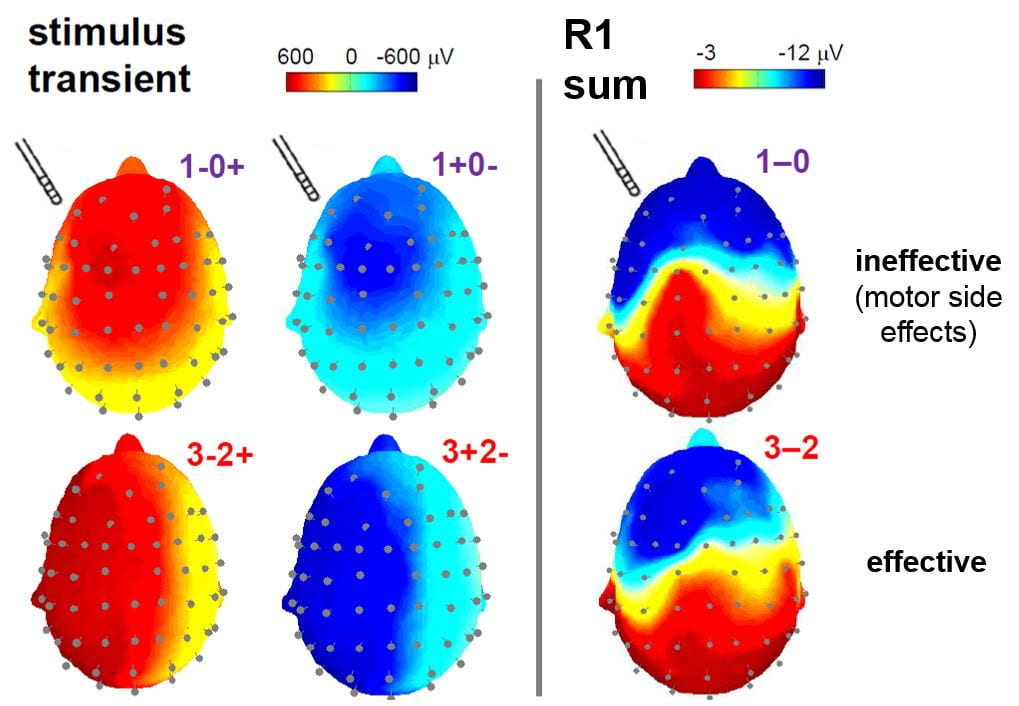
Figure 1: Spatial topographic maps of the stimulus transient, R1, and HFA. a. Stimulus artifact removal performed by reversing the anode and cathode DBS contacts (i.e., 1+0−vs. 0–1+, gray traces). Summing the corresponding pairs of ERPs removes the DBS artifact and amplifies the brain response of interest (red and purple traces). The short latency ERP consists of an initial downwards deflection at a mean latency of 0.860.09 msec (R1) followed by an upwards deflection. Large amplitude evoked high frequency activity (HFA) occurs later in contacts with (purple trace) vs. without (red trace) motor side effects. b. Field maps of the stimulus transient peaks show polarity inversion upon reversing the anode and cathode DBS contacts, consistent with a deep subcortical source. In contrast, short latency R1 phase reversals occuripsilateral to the DBS electrode in the Rolandic region, whereas scalp maps of the HFAs suggest a more complex, but still primarily ipsilateral source. [Color figure can be viewed at wileyonlinelibrary.com]

Figure 2: M1 and S1 activity evoked during STN DBS with the Boston Scientific 8 contact directional DBS lead.
(A) Electrode schema. (B) Post-hoc reconstruction of 3T PRISMA brain images, with ECOG contacts co-localized from intra-op O-arm 2 CT images. (C, D) In two participants, stimulation was delivered at 5 mA from each contact, using the remaining contacts as the current sink. Additionally, segmented rings were stimulated together to create a “virtual ring” configuration. Note the gradient of M1 to S1 activation across the directional contacts in participant 1 (C), and that both circular and virtual rings often elicit larger ERPs.
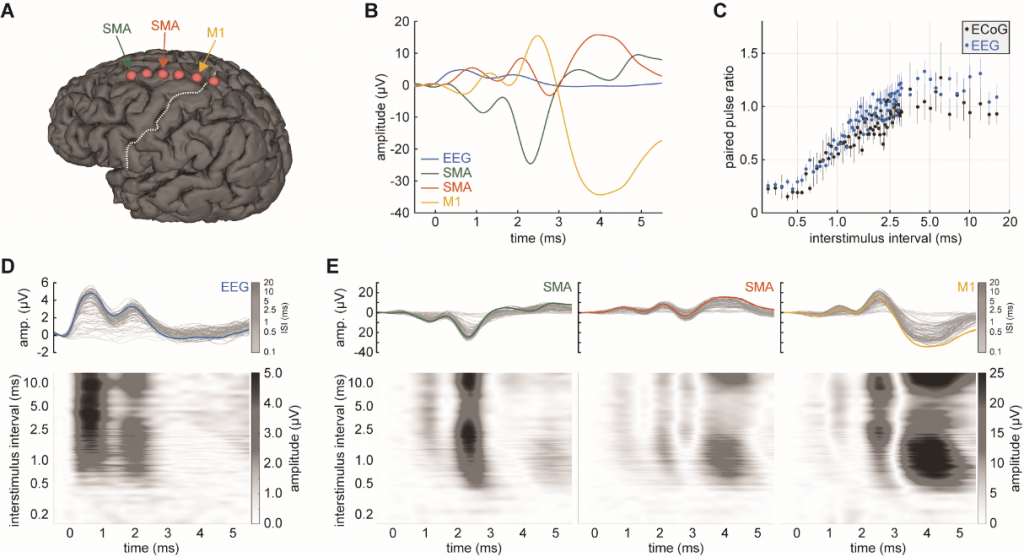
Figure 3: A) Rendering of ECoG contacts over SMA and M1 (intraoperative O-arm images coregistered to pre-op brain MRI in Free Surfer). White dashed line highlights the central sulcus. B) EEG and ECoG potentials elicited by STN DBS. C) Paired pulse ratio for the early potentials by interstimulus interval (ISI). This paired pulse ratio is defined as the area of the response to the test stimulus divided by the response to the conditioning stimulus over a latency range of 0.2to 1.5ms. Data are represented as mean ± SEM. D) and E) Amplitude and latency of EEG and ECoG channels across ISIs. Multiple short latency responses occur at discrete peak latencies of 0.7 to >5ms. Color traces represent the template response to the conditioning stimulus within each channel. All responses display relative and absolute refractory periods at ISIs of <2.5 ms and <0.6 ms, respectively.