I’m a fan of the web comic XKCD by Randall Monroe, which takes esoteric math and science concepts and turns them into jokes. In one edition, Monroe tackles the issue of multiple hypothesis testing: If you test many hypothesis simultaneously without adjusting your significance cutoff (e.g., p<0.05), false positives are going to happen more than you might expect.
In the related edition of XKCD, two characters want to know if jelly beans cause acne. Scientists investigate this claim and find no link between jelly beans and acne. That is, the scientists test the null hypothesis, “There is no statistically significant relationship between jelly bean consumption and acne.” The results will not surprise you.
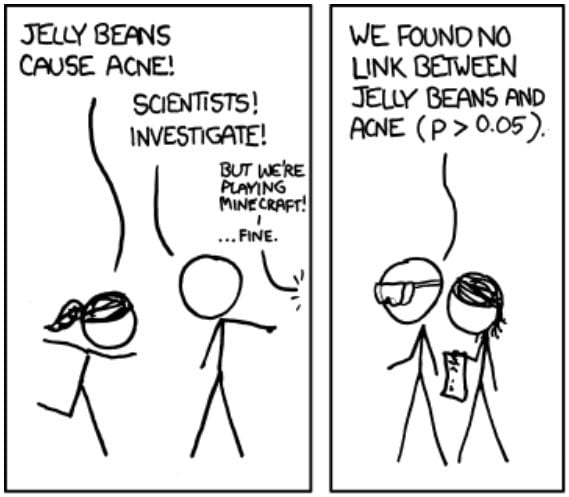
In this joke example, the scientists test one hypothesis, calculating one p-value and comparing that one p-value to a critical value (here 0.05). No problem so far. But, what if I am concerned that one specific color out of a possible, say, 20 jelly bean colors causes acne?
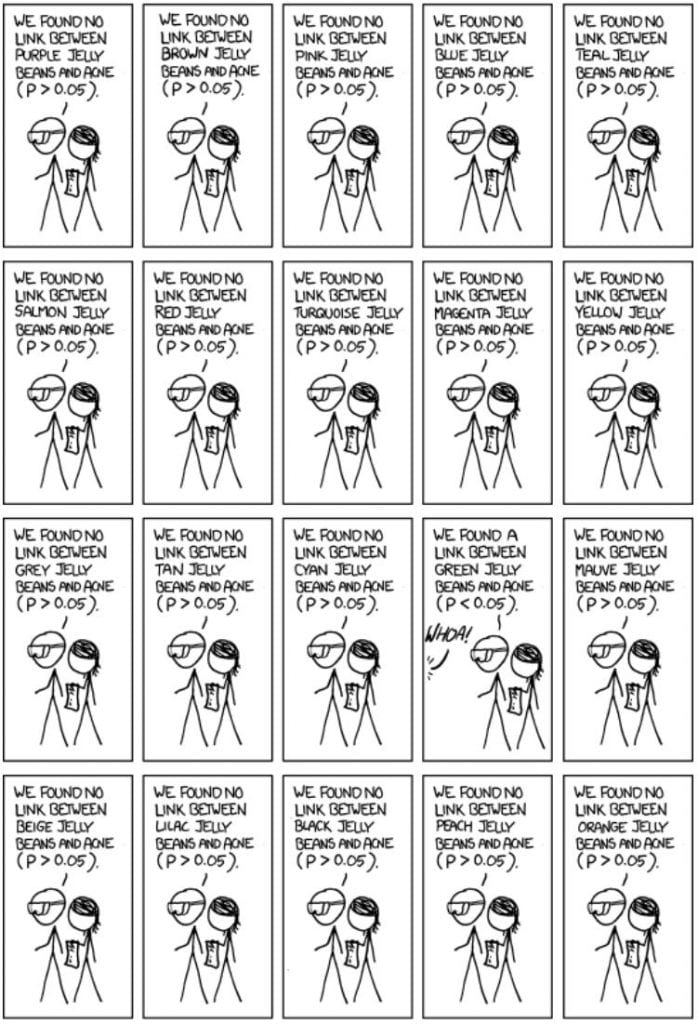
So green jelly beans cause acne? I can see the headlines now.
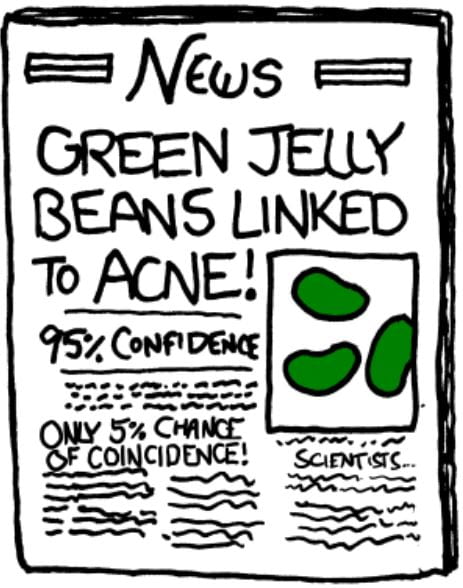
Notice that part of this joke front-page news there is a comment “only 5% chance of coincidence.” Is that right? If the scientists had tested a single hypothesis, then yes. However, that’s not what happened. The scientists tested 20 hypotheses. So what are the odds this result happened by chance?
Remember that a p-value tells you the likelihood of getting a result as extreme or more extreme by chance. That means for a single hypothesis test, the p-value tell you the likelihood of getting something like your result by chance. What about if I tested 20 independent hypotheses with a cutoff of 0.05? In that case,

There is a 64% chance of at least one false positive. Said another way, it is more likely than not that this experiment will yield at least one false positive just by chance.
What do we do?
The simplest approach is to divide your cut off value by the number of simultaneous hypotheses (Miller 1981). This process is called a Bonferoni correction In this case, that would be

You may think, “That’s a very strict cutoff.” You’re right. This cutoff will do a great job of preventing false positives. In fact, we can prove it.

This number, 0.0488, can be thought of as the cut-off equivalent. If we were to somehow condense all 20 tests into 1, the cutoff for this test would be 0.488. However, as you might expect, this process results in more false negatives than would be expected from a single hypothesis test. In fact, you can prove that the false negative rate tends toward 1 as the number of tests increases (Efron 2004). That is, if you do a lot of simultaneous tests with this method, you’ll fail to reject the null hypothesis nearly every time, regardless of whether there is actually a relationship in your data.
The Bonferoni correction is still useful, though. If having even one false positive would mean disaster for your work, then the Bonferoni correction may be the way to go, as it is quite conservative. Likewise, if you are testing only a small number of hypotheses (say <25) and you expect (based on prior knowledge) that only one or two are true, the Bonferoni correction may be the way to go.
There are other options. I’ve linked to resources on a few below, but I would suggest reaching out to a Data Scientist for a consultation on what the best option is for your particular research project.
One option is to control the False Discovery Rate (FDR). For a practical guide to this process, see the section “Controlling the false discovery rate: Benjamini–Hochberg procedure” on this external blog post. For a theoretical description, see Benjamini and Hochberg 1995.
Another option that has shown promise in Anesthesia and Analgesia literature (double meaning intended) is to re-frame your hypotheses to do joint hypothesis testing or a “gate keeping” procedure where you test a second hypothesis under the condition that the first is true (Mascha and Turan 2012).
You can also calculate Benjamini–Hochberg adjusted p-values, sometimes called q-values in some statistical software. However, these adjusted p-values lack the theoretical backing of typical p-values and methods for controlling FDR. They can be useful for quick-and-dirty analysis, but they should be avoided for publication purposes. A careful reviewer may object that such q-values lack statistical rigor. If you want to learn more about these adjusted p-values, these Berkeley lecture notes provide a succinct guide.
References
Munroe, Randall. “Significant.” XKCD. https://xkcd.com/882/.
Miller, R. (1981), Simultaneous Statistical Inference (2nd ed.), New York:
Springer-Verlag.
Efron, B. (2004). Large-scale simultaneous hypothesis testing: The choice of a null hypothesis. Journal of the American Statistical Association, 99(465), 96–104.
Mascha, E. J., & Turan, A. (2012). Joint hypothesis testing and gatekeeping procedures for studies with multiple endpoints. Anesthesia and Analgesia, 114(6), 1304–1317.5
Benjamini, Yoav, and Yosef Hochberg. “Controlling the false discovery rate: a practical and powerful approach to multiple testing.” Journal of the Royal statistical society: series B (Methodological) 57.1 (1995): 289-300.
